When a derecho tears across the Great Plains, every turbine in its path meets roughly the same storm. Yet the damage is always the same puzzle: hundreds of machines standing, and a handful folded over at mid-tower like bent straws. If the wind was strong enough to destroy one, why did its neighbours survive? We rebuilt a strike from the physics up to find out.
Real-time aeroelastic reconstruction of the worst-case derecho encounter, with synchronised tower load and stress displays. As the gust front veers the wind across a turbine frozen off-heading, the critical section walks up toward its buckling limit.
The reconstruction
We modelled a representative 1.5 MW turbine — the class that dominates the legacy US fleet — in NREL's OpenFAST aeroelastic code: a 70 m rotor on an 80 m hub, on a realistic commercial tower (4.3 m base, 20 mm wall, S355 steel). Crucially, we assessed the tower the way real towers actually fail — by shell buckling (Eurocode EN 1993-1-6), not a simple yield check. For this tower, buckling cuts the usable capacity to roughly 68 % of what a yield check would flatter you into believing.
Then we ran two storms with identical wind magnitude — a 50 m/s (112 mph) ten-minute mean gusting to 70 m/s (156 mph), the IEC Class I extreme-wind level:
- The certification storm (IEC DLC 6.1): turbine parked, blades feathered, nacelle within 8° of the wind — the case every Class I turbine is designed to survive.
- The derecho: same mean, same gusts — but with the storm's fingerprints. A gust front that veers the wind 90° in twenty seconds and keeps drifting to 120°; cold, dense outflow air (+8 % on every load); gustier turbulence; stronger shear. And decisively: the grid fails at the front, the yaw drive dies, and the nacelle is frozen at its pre-storm heading.
Same wind, two outcomes
| Same wind, two storms | Peak tower utilisation (of buckling allowable) |
|---|---|
| IEC design storm, rotor aligned | ~0.45 — comfortable survival |
| Derecho, frozen yaw, 90–120° off-wind | ~0.9 — at the edge |
The wind speed never changed. What changed is that the derecho rotated the wind around a turbine that could no longer follow it. A feathered rotor is nearly invisible to a storm hitting it head-on; turned broadside, its blades and tower become a wall. And the simulation puts the critical stress exactly where field investigators find the folds — 30–40 % up the tower — while the steel never comes close to yielding. Buckling, not strength, is the story.
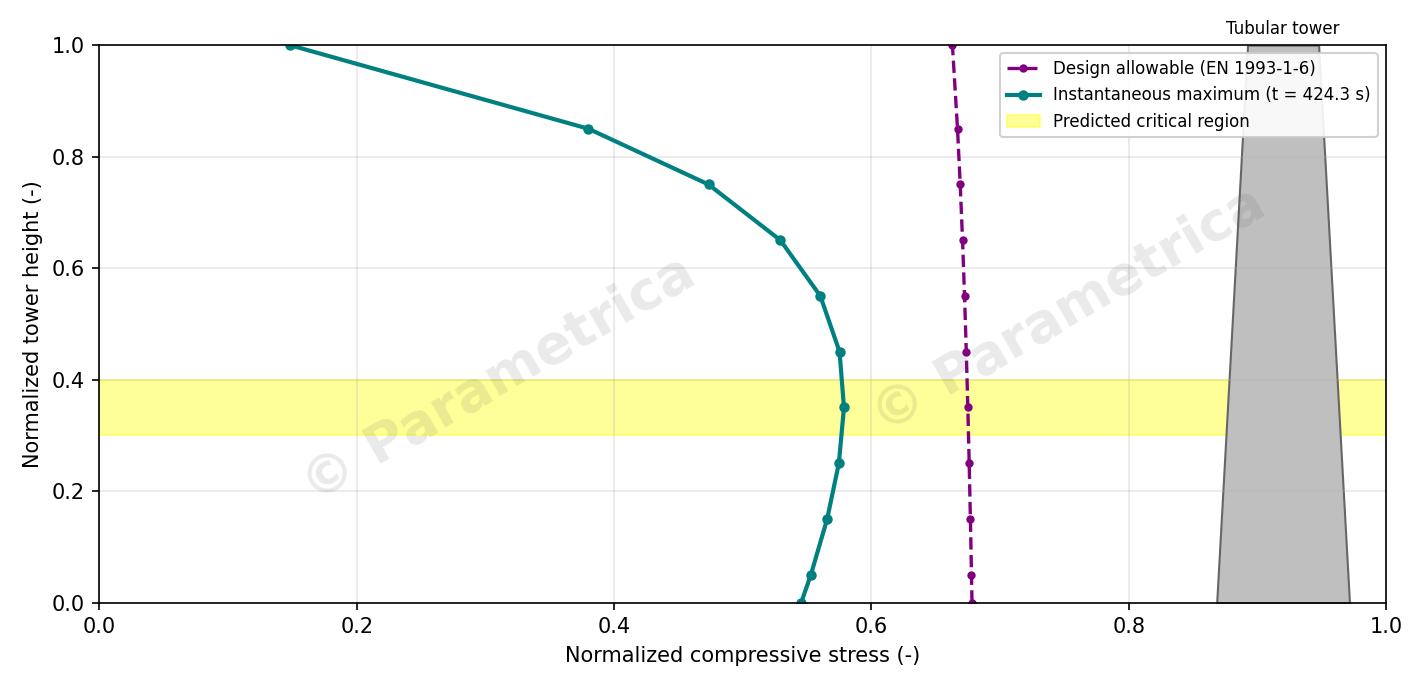
At the peak instant, compressive stress up the tower (teal) presses against the buckling allowable (dashed) precisely in the lower-third critical region (highlighted) — the height at which storm-collapsed towers fold in the field.
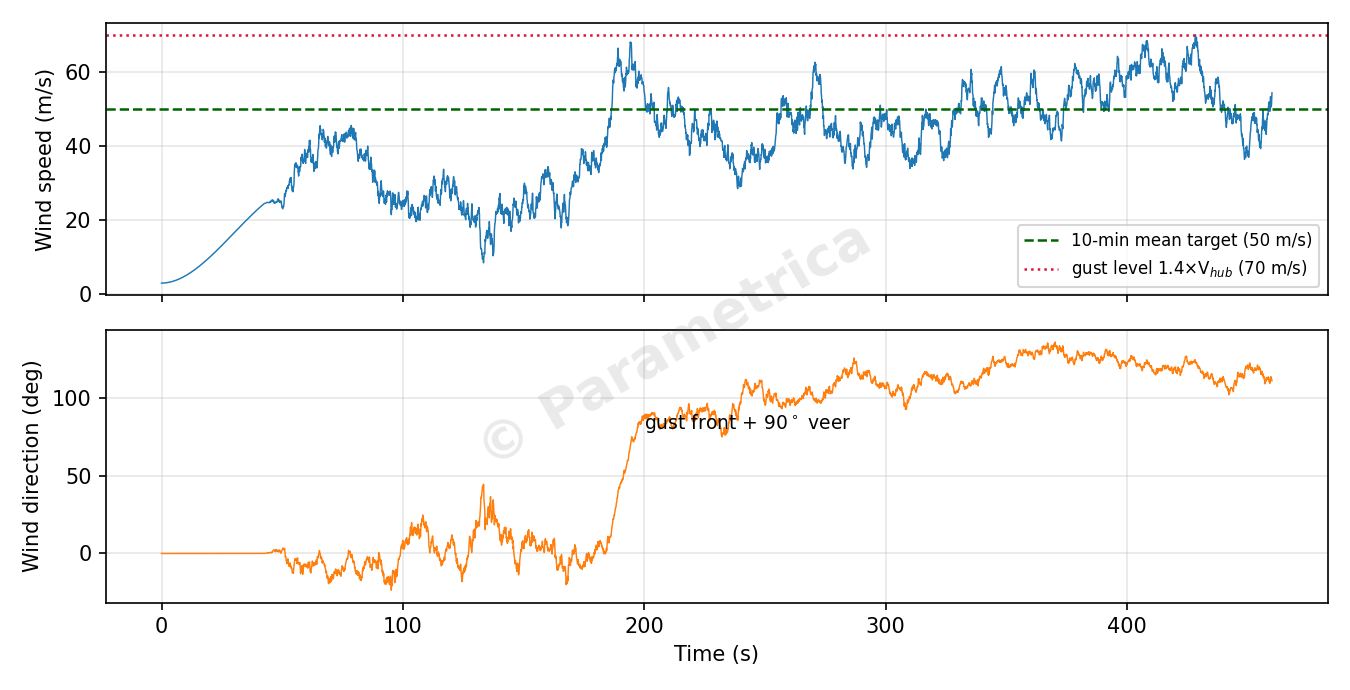
The derecho's signature: the wind holds at the certified speed while its direction sweeps through 90–120°. Speed is not the discriminator — the veer is.
The stop-position lottery
Because every turbine freezes at whatever heading, rotor position and brake state it had when the grid died, we ran the full matrix of stop positions under the identical derecho. Three practical lessons:
- Let it idle. A locked rotor was consistently worse than a freely idling one (up to ~1.0 of the allowable versus ~0.85) — locking pins one blade in its worst orientation for the whole storm.
- Pre-aiming the nacelle helps less than you'd hope. Point it at the forecast gust-front direction and the post-frontal drift re-misaligns it into a shallow skew, where feathered blades start generating lift again. Preparation has to reckon with the storm's whole veer trajectory, not one direction.
- No stop position is a rescue. Positioning tunes the demand by ±15–20 %. It is worth doing — but at derecho magnitude, the decisive protection is structural margin.
That is exactly why derecho damage is selective: within one farm, each turbine draws a different ticket in the direction-versus-heading lottery, and only the unlucky conjunctions fail.
Why this matters for risk
Conventional storm-risk screens ask one question: did the wind speed exceed the design value? This reconstruction shows a derecho can push a code-compliant turbine to its structural limit without ever exceeding the design wind speed — while most of its neighbours in the same swath are fine. A wind-speed footprint cannot separate the two. Physics-based reconstruction — wind trajectory, machine state, buckling-based capacity — can, and it extends naturally to fleet-level fragility curves: the probability of loss as a function of storm intensity and encounter geometry.
After every storm loss, the debate rushes to a single number — how strong was the gust? Claims and root-cause arguments get anchored to it. The right question is not how strong was the wind but what did the wind do, and what state was the machine in when it arrived? Wind-speed footprints and generic vulnerability curves cannot tell you which turbine in the row goes down. Physics can. That is the gap Parametrica was built to close.
Methods in brief: OpenFAST v4.2.0 aeroelastic simulations; NREL WindPACT 1.5 MW baseline rotor with a representative commercial tower (f₁ = 0.35 Hz); parked/idling, blades feathered 90°; derecho wind synthesised as a gust-front time history (Ornstein–Uhlenbeck turbulence, TI 13.3 %, gust factor 1.4) with 90→120° veer, ρ = 1.32 kg/m³, α = 0.20; tower capacity per EN 1993-1-6 meridional buckling evaluated at 11 stations over height. A demonstration reconstruction by Parametrica; a full technical manuscript is in preparation.